
So you’ve got research, data or information that’s valuable to your audiences. Only problem is, you’re not sure how to share the content to create the impact it deserves.
Unless your audience is used to reading research papers, they’re unlikely to respond well to lots of text. Instead, data visualisation techniques help you turn the numbers into meaningful outcomes through images, graphs, charts and more.
Infographics are one type of data visualisation that’s extremely effective. They summarise the key findings into a series of graphics with some accompanying text. But we challenge you to go beyond static infographics and create video infographics that captivate your audience!
We have made it easy to plan your infographics with a simple worksheet that you can download here 👇

Why should you create video infographics?
Static infographics can be powerful but do you ever feel like you’ve been hit by a wall of numbers? It can be difficult to piece together each bit of information to get a feel for the overall trends the data shows. Take this example from eMarketer on the growth of social media platforms, TikTok and Douyin.
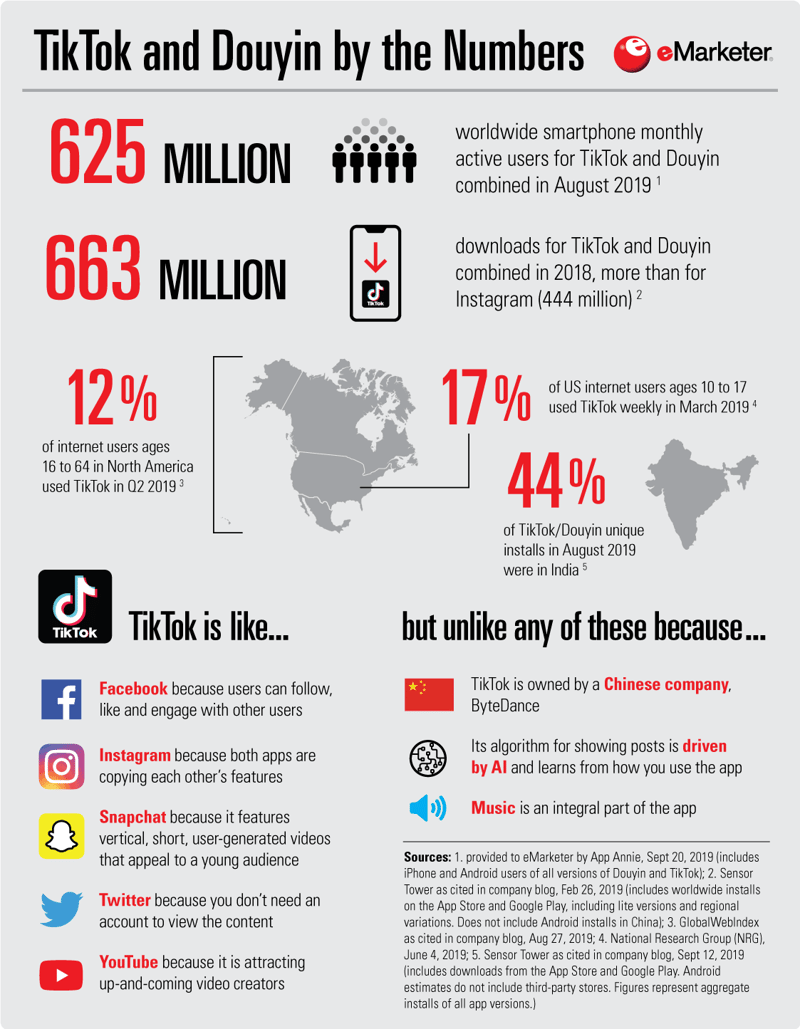
However, with video infographics, you can take your audience on a journey and hold their hand through the data. Starting with the background to the research and why they should care, right through to the meaty detail of your findings. Walking your audience through the information piece by piece building up to the full picture. Just like we’ve done with this same eMarketer data.
With that in mind, if you want your audience to fully engage with the information and leave with the knowledge you intended then video infographics are for you! And not to mention the fact that video content outperforms static content across all channels from email and websites, to social media and presentations. Find more research on the power of video here.
Let’s look at how you can create your own video infographic in 6 easy steps using VideoScribe (if you haven’t already, start your free seven day trial now).
Step 1: Outline your objectives and target audience
First things first, you need to determine what you want to achieve with your video infographic. Without a firm goal in mind, it’ll be difficult to create a targeted video that packs a punch. Your aim could be any of the following:
- Increase website visits
- Convert prospects into customers
- Boost social media engagement
- Enhance your brand with market leading content
Similarly, while all the research you’ve collected is interesting to you, your audience might not feel the same way. To create maximum impact, keep your specific audience’s motivations and interests in mind at all times and position this at the start of your video.
If you’re not entirely sure what their true pain points or motivations are. Try using the ‘five whys’ technique to hone in as we have in this example video.
Step 2: Collect and analyze your data
Now you know who your video is talking to and the outcomes you want to drive, gather your data. This could be from:
- Primary research (interviews, surveys, focus groups and business reports)
- Secondary research (industry reports, competitor content and other third party research)
Once you’ve organized the information and analysed it for key trends, findings and correlations, ask yourself these three questions to determine what the main focus of your video will be:
- What’s the core message/trend you want to convey?
- What do you want your audience to leave knowing?
- Which of your results is going to grab your audience?
Step 3: Plan and storyboard your video
The next step we recommend is to plan out your video infographic in full. This doesn’t have to be a long process, but mapping out how your video will start, progress and end will make creating your video easier and ensure you don’t miss any key information.
The main video elements to plan are:
- What your call to action will be based on your objectives
- Whether there are any brand guidelines you’ll need to follow i.e. colors, fonts and styles
- Whether you’ll need subtitles or translations into multiple languages that might require additional time to produce
- How long you want your video to be - consider the fact that if your video is for social media attention spans are much shorter. Find more information on this here.
When it comes to how you plot your video out, a storyboard is a great option. A storyboard allows you to break your video down scene by scene to experiment with how your information will flow.
Download our free storyboard template here.
Step 4: Write your script and record your voice-over
It’s time to talk voice-overs. You don’t necessarily have to have a voice-over at all but consider the fact that your audience is likely to be made up of lots of different types of learners and while visuals help most of us learn, audio can be a fantastic reinforcement.
A script that supports your key points and helps to guide your viewer through the information will help your video to be more memorable and easily understood. We recommend recording your voice-over before you start creating your video as it often determines the pace of your animations and helps you stay on track.
If you’ll be sharing your video infographic with international audiences, read our advice on ensuring an easy translation here.
Step 5: Produce your video
Bring on the fun part! Now’s your chance to get creative with images, charts, animation and music. You can choose from the thousands of graphics in our library or import your own. But don’t miss…
- Adding geographical statistics to our latest map images covering continents and countries
- Creating your own animated graphs and charts to display data
- Making your video even faster with our ready-made templates
- Changing the color of our images to suit your topic or brand
If you need any help along the way, our friendly support team are always here to help.
Step 6: Export your video and market it!
Now all that’s left to do is save your finished video in the file format of your choice and share it with the world.
Depending on your objectives, you might share the video on social media tagging relevant partners, create a GIF version to entice your email database to download the full video, or host it on your website to attract new visitors.
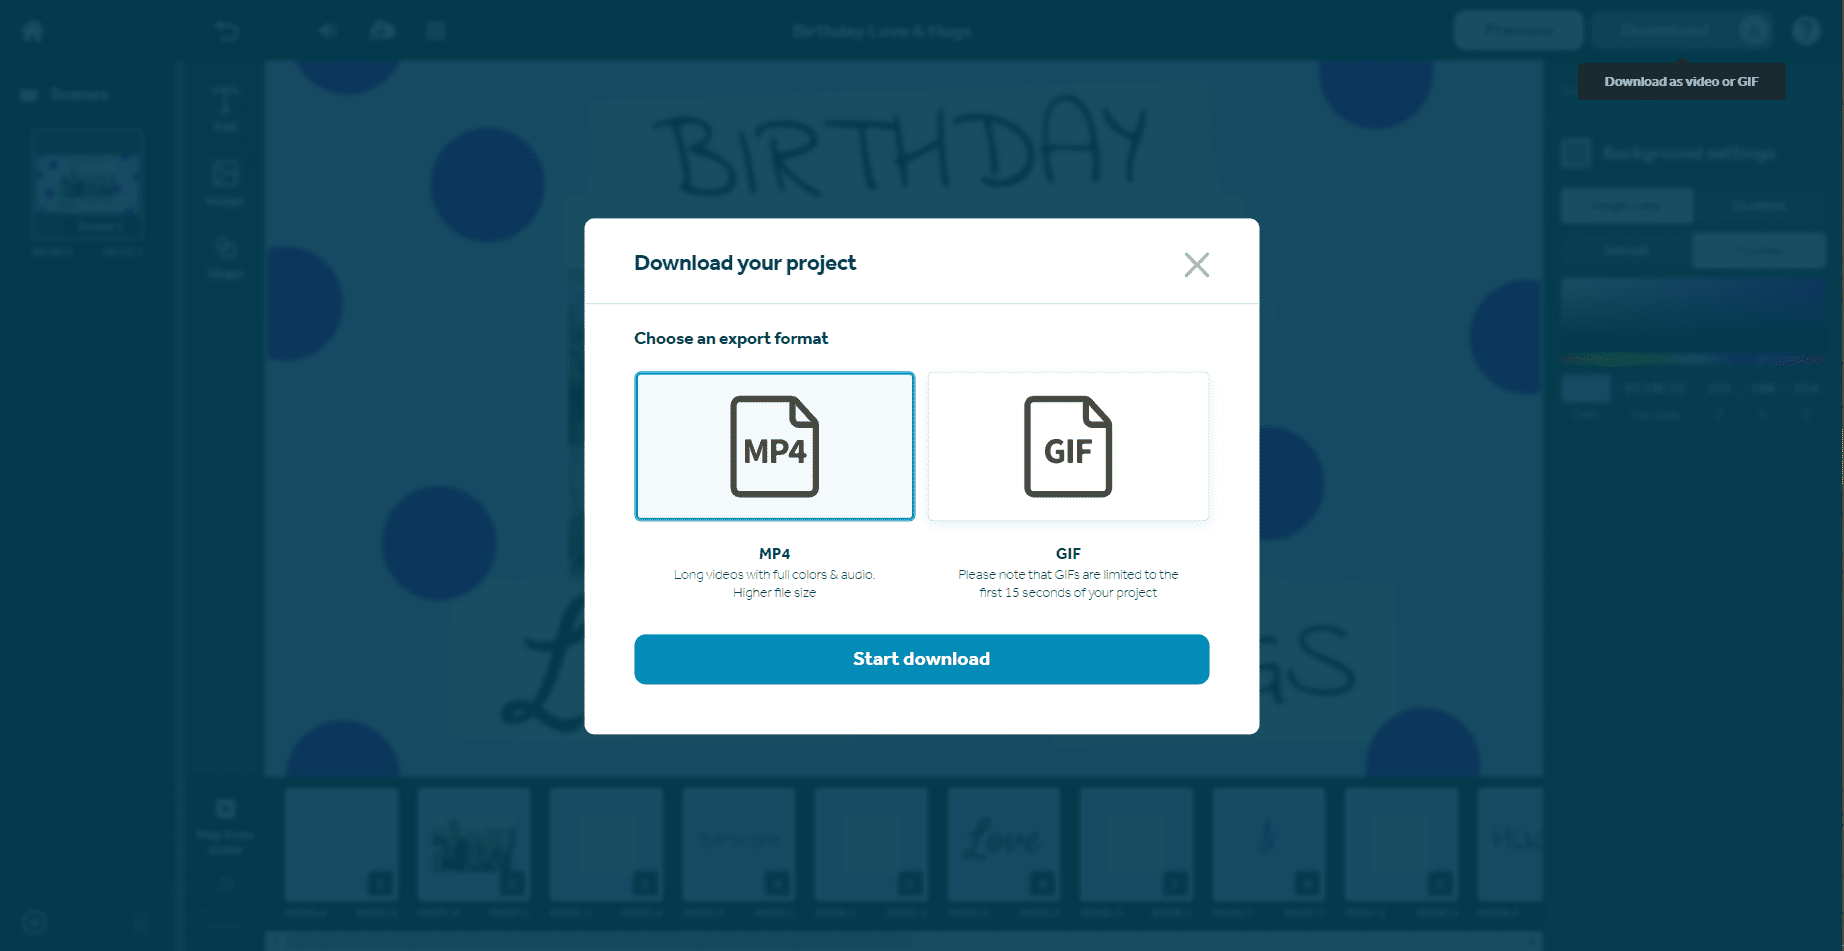
VideoScribe gives you the choice to download your full video as an MP4 file or to transform it into a GIF. You can find these options by clicking on the blue Download button in the top right of the screen.
Just like that, you have your own video infographic that delivers results for your organization!
Ready to get creating? Start a free trial of VideoScribe today (no credit card needed).
.png "VideoScribe")


![How to create animation magic [3-part guide to video success]](https://blog.videoscribe.co/hubfs/How%20to%20create%20animation%20magic%20guide%20VideoScribe.png)
.jpg)


COMMENTS