
Research conducted by VideoScribe has revealed that visuals are a vital component of effective learning that should be incorporated into teaching methods. With the likes of Netflix introducing “90 minute movies”, many business models are beginning to tailor to the dwindling average attention span. A recent study by Microsoft revealed that the human attention span has dropped to eight seconds. If you’re wondering what this means, it’s a clear indicator of attention spans depleting, decreasing by nearly 25% in just a few years,
There is evidence that this may well be more than partially linked to the increased use, and in turn, reliance, of technology, primarily the use of social media and the online realm in general. A study by Ofcom has shown that UK adult internet users spent almost 4 hours online a day with 3 of those hours spent on smartphones.
Visual Learning: Tailoring Teaching for Gen Z
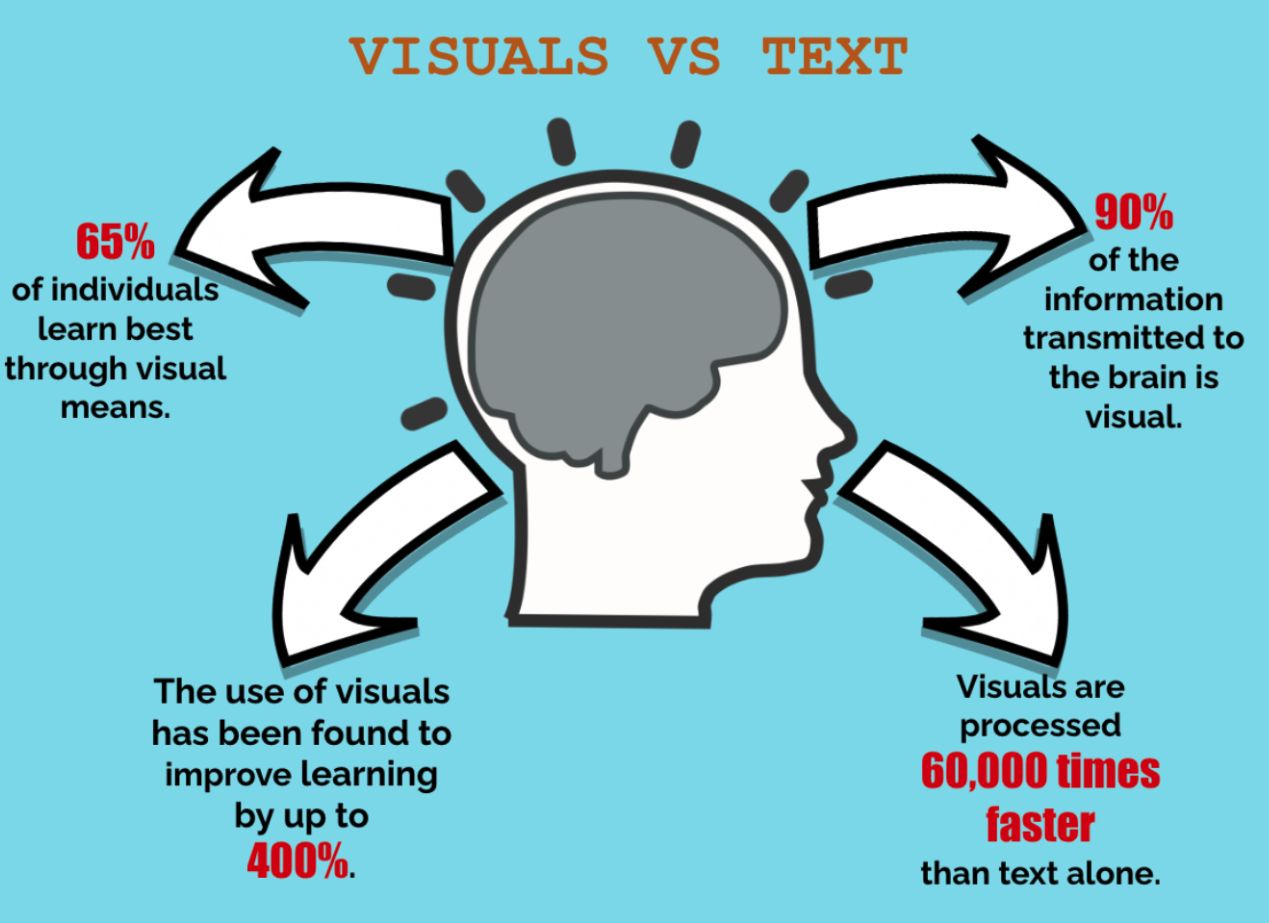
Attention span and memory retention alike are thought to be two of the main cognitive functions that have been impacted by the increased use of digital technology. Further studies have shown that the majority of people are visual learners, with 65% of individuals learning best through visual means. With this in mind, are graphics the key to memory retention? What can be done to ensure that everyone is optimising their learning capabilities?
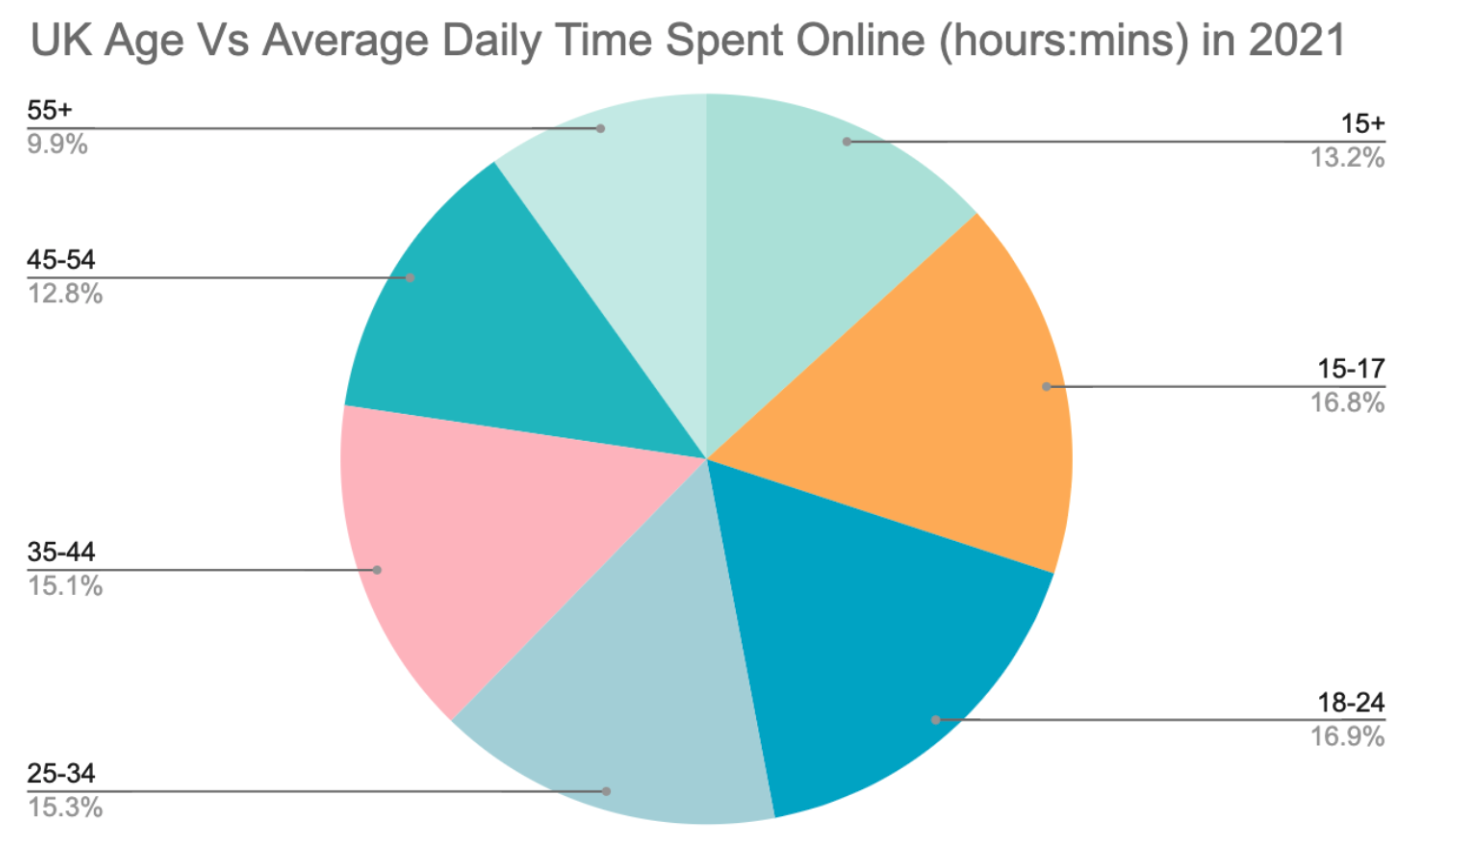
As people aged between 15 - 24 spend the most time online, at an average of 5 hours 5 minutes daily, it’s fair to assume that this figure will increase as time goes by and education begins for the next generation, born into a world of social media, Web 3.0 and never logging off.
| UK age | 15+ | 15-17 | 18-24 | 25-34 | 35-44 | 45-54 | 55+ |
|
UK age average daily time spent online |
03:59 | 05:04 | 05:06 | 04:36 | 04:32 | 03:51 | 02:58 |
Advantage or Dependance?
Although it is thought that the use of technology and the internet are the cause of our dependence on visual information such as diagrams, imagery and graphic depictions, the preferred method of visual learning actually predates the Digital Age.
The use of visuals has been found to improve learning by up to 400%. Other findings have shown that most people will only read up to 28% of plain text on a webpage, with the most common figure landing at 20%, only managing to read one-fifth of an entire page. A combination of skim reading and stopping short is the result of this, so what can be done to ensure that most people are able to take in and retain information?
Dr. Penny Trayner, a Paediatric Clinical Neuropsychologist, Chartered Psychologist Registered Practitioner and Clinical Psychologist from Clinical Neuropsychology Services Ltd commented on visual learning and its relationship with memory retention:
“You may have read in the press that theories about the dominance of learning styles have largely been debunked as an oversimplification. The likelihood is that most of us (95% of people) will fall in the average range of ability for most skills. Individuals will be strengths and weaknesses within their own profiles, but there is no way of establishing this without detailed cognitive testing that is unnecessary for most people. But the good news is that memory theory and research tell us that ‘richly’ encoded memory traces are much more likely to be retained, and multi-modal learning is a way of more richly encoding information. See it, discuss it, experience it.
In reality, we likely all have strengths and preferences for the way we learn, and the best way to learn something varies from task to task. Taking a broad approach and making education as engaging as possible, targeting multiple senses in different ways, creates the best possible conditions for learning.”
Visuals are 83% More Effective Than Text Alone
A study revealed that participants retained 25% of written or spoken information but almost 80% of visual information after three hours. However, 3 days later they were shown to have retained only 10-20% of written or spoken information but almost 65% of visual information.
| Presentation | Ability to recall | |
| After 3 hours | After 3 days | |
| Spoken lecture | 25% | 10-20% |
| Written (reading) | 72% | 10% |
| Visual and verbal (illustrated lecture) | 80% | 65% |
| Participatory (role plays, case studies...) | 90% | 70% |
Another study showed that an illustrated text was 9% more effective than text alone when testing and 83% more effective when the test was delayed. It’s clear to see how the use of a graphic can enhance the user experience, allowing for a more memorable, visual representation of the words describing the same thing.
The Power of Visual Interpretation
As the brain has the ability to see images that last for just 13 milliseconds, just over one-thousandth of a second, it’s clear that visuals play a hugely important role when it comes to retaining information. In fact, visual information is deeply embedded in our processing and learning capabilities, with our eyes being able to register a whopping 36,000 visual messages per hour. These figures are hard to truly comprehend, but this further goes to show that visual information is highly important, being processed on a subconscious level that we aren’t even actively aware of!
According to a study by MIT, 90% of the information transmitted to the brain is visual. This is a huge proportion when all things are considered. With nine-tenths of the information we receive being obtained from visual means, we are able to understand a visual scene presented to us in just one-tenth of a second. Studies have shown that visuals are processed 60,000 times faster than text alone, meaning that if teaching methods rely solely on a singular method, without the inclusion of relevant visuals, then a huge amount of potential is being wasted, not allowing for the most sufficient levels of learning retention by the majority of people.
Additionally, 40% of nerve fibres within the body are linked directly to the retina, the area within our eyes that processes visual information and allows us to see. As just just under half of our nerve fibres are dedicated solely to processing information obtained through sight, the link between our brains and their capabilities in ensuring memories stick becomes increasingly evident!
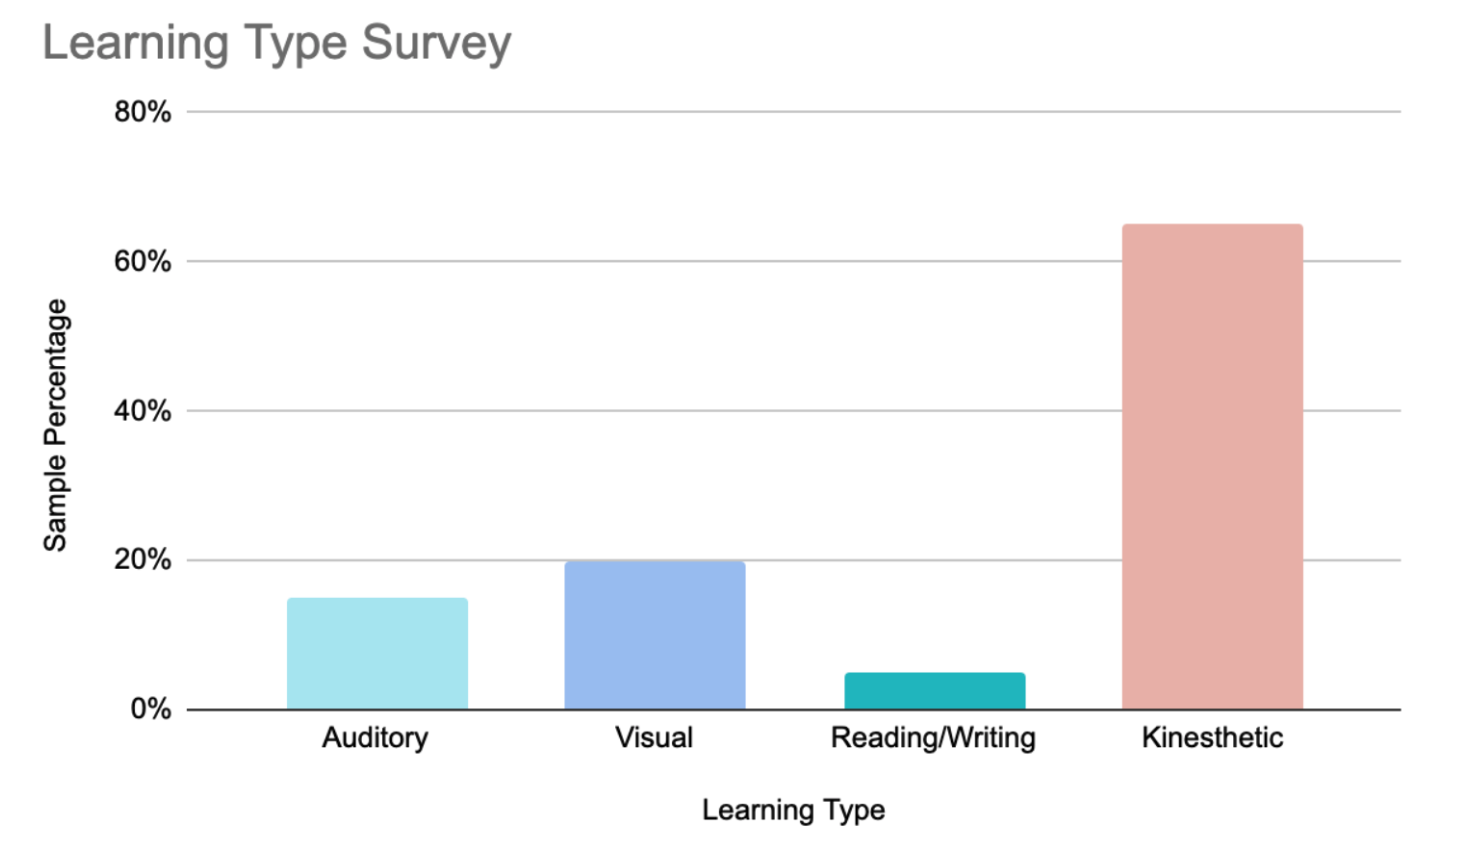
A poll conducted by VideoScribe surveying 30 adults found that when participants were asked what their learning style is, 15% were auditory learners and 20% were visual learners. However, most believed that they were kinesthetic learners, with 60% retaining information best when actually doing a task, rather than watching or listening. Only 5% of respondents stated they learned best through reading or writing, further revealing that text alone is one of the most ineffective techniques when attempting to retain information.
Pros of Visual Teaching Methods
It’s one thing to look at the data and studies relating to the use of visuals within a teaching environment, but when it comes to the education of kids, looking at things from a real life point of view can often be the best way to assess the true benefits.
As well as the scientifically proven benefits of using visuals within teaching to improve memory retention, the following has been proven in the teaching of children with visuals used as the main method.
To give a brief overview of the benefits of using visual methods when teaching children:
Visuals Teaching is Inclusive
Before we have the ability to read, we are learning through the world we observe around us. Children who don’t yet understand how to read and write can find great benefit from the use of visuals for this very reason.
Visuals Allow Processing Time, Enhancing Retention of Information.
As we interpret most of our information through sight, visuals have been shown to improve processing time, leading to the heightened retention of information.
Visuals Offer an Alternative to Reading
With attention spans decreasing year by year, using visuals allows for a more highly engaging form of communication in a learning environment. Rather than expecting children to simply listen, showing them an image that represents the message being presented will allow for increased engagement and enhanced learning retention for those who struggle with concentration.
Visuals Allow for Neutral Engagement
When kids take in information, they see much more than the person who communicates it to them. Body language, tone of voice, emotion, and the child’s perception of their teacher will all come into play, potentially prohibiting their ability to take in the information they’re being presented with. An image can show what exactly is required, contrasting with an adult giving instructions that has many different areas that a child must process.
A study by Ofcom shows that the devices children use for the internet differ vastly depending on their age. The study revealed that all children, aged between three and fifteen, used a tablet, suc as an iPad, more than any other device. In fact, all age groups considered within the study, with the exclusion of the youngest children aged 3 to 4, are most likely to use a computer tablet. As all children above the preschool age are using a tablet most, this further supports the theory that visuals are an important, if not the most important, component in learning. Computer tablets are a great example for a visual way of interpreting information, with a large screen that fits within the user’s hand, almost exclusively relying on imagery and graphics in the way they convey information.
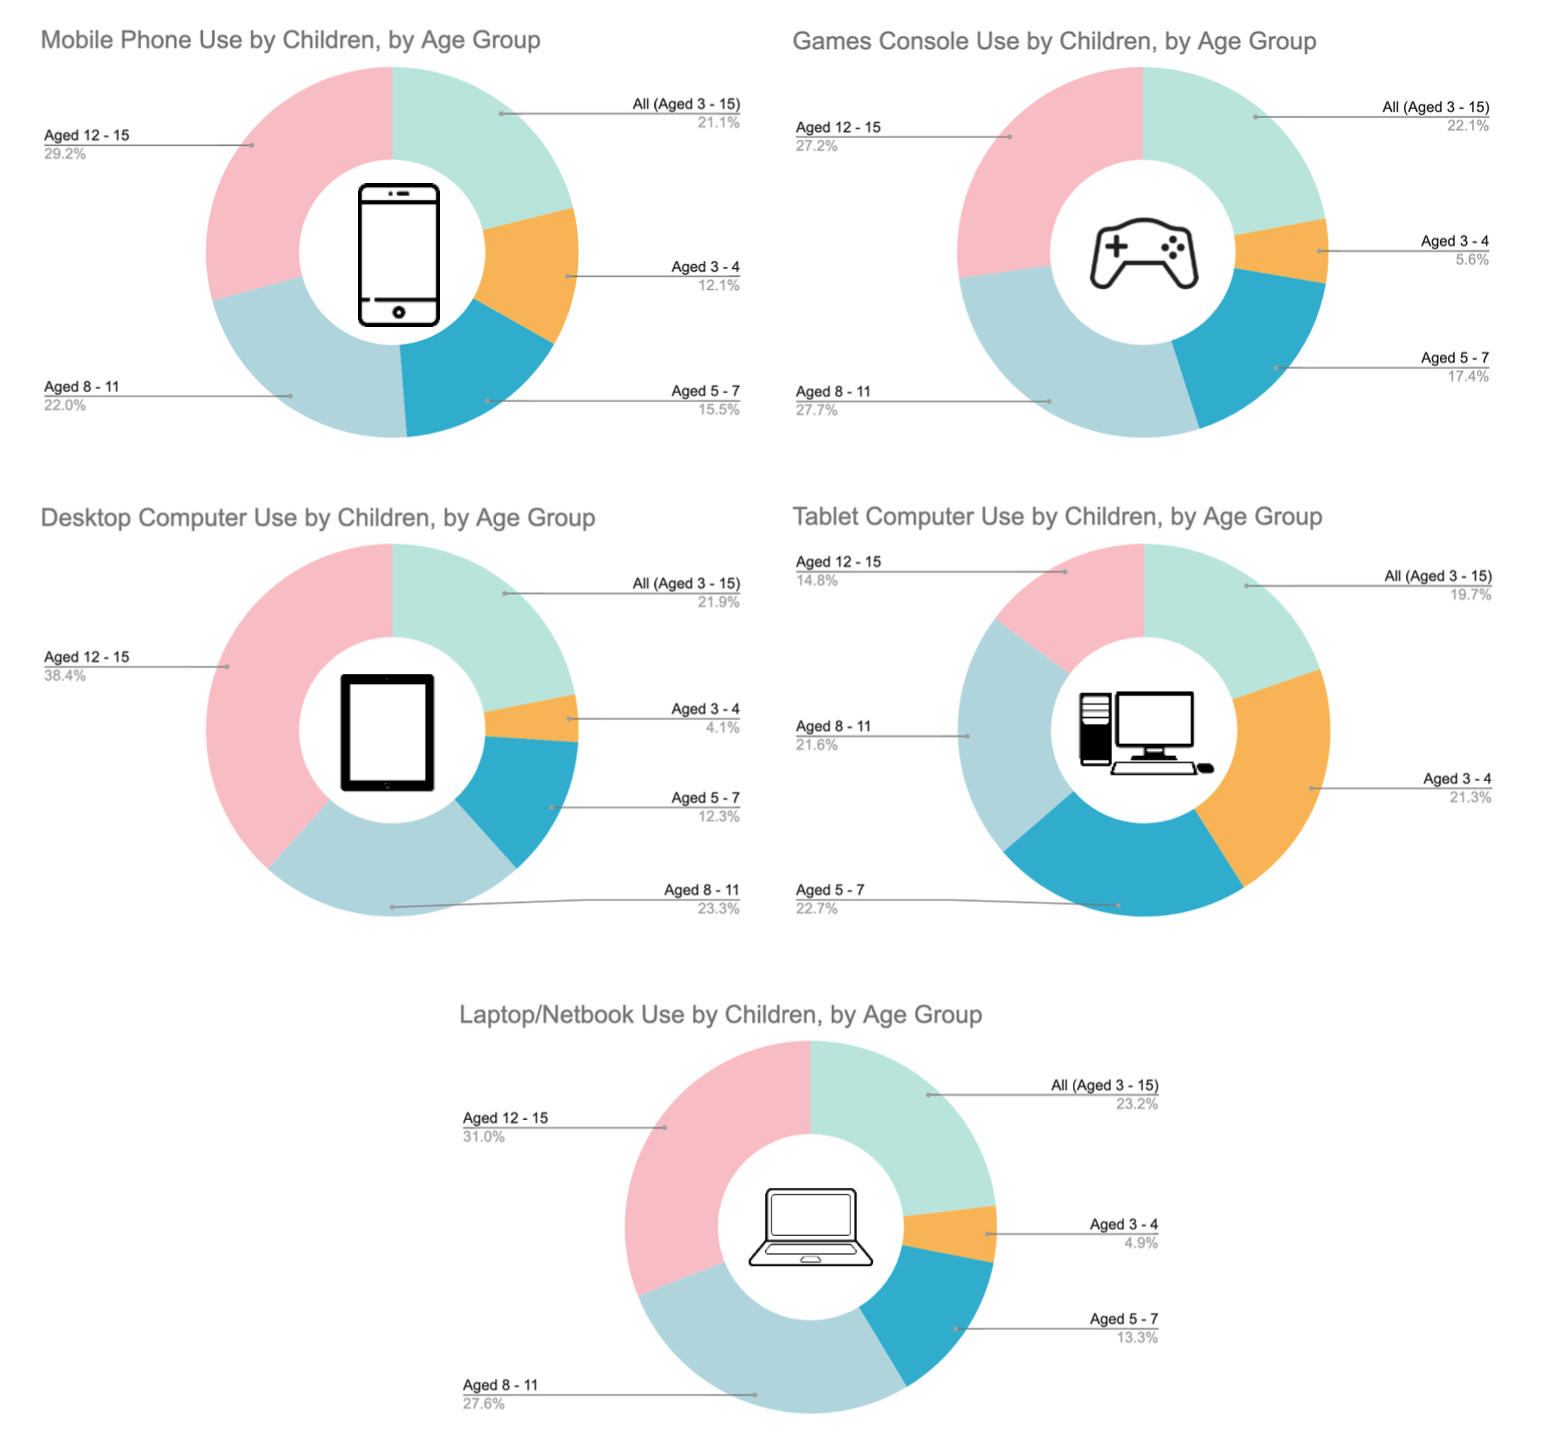
Additionally, although this seems as if kids use devices to access the internet at a high level, the same study showed that “11% of parents with primary school-age children and 3% with secondary-school-age children at home said that the children in their household ‘rarely’ or ‘never’ had adequate access to an appropriate device for their schooling needs.”
Why Visual Learning is the Future
It’s clear that for children and adults alike, using visuals is key to the most impactful, long lasting form of learning, increasing levels of memory retention.
As the next generation who are born into the Digital Age continue their education, understanding the mediums they use on a daily basis is key to enhancing and tailoring teaching methods that work for them.
There’s also a clear and direct link between the use of technology, the reliance on visual information and the average reduction in attention spans. As trends last a shorter amount of time, year on year, the attention span of the average user also decreases. To use an example, 2013 Twitter global trend would last for an average of 17.5 hours, contrasted with a 2016 Twitter trend, which would last for only 11.9 hours.
.png "VideoScribe")


![How to create animation magic [3-part guide to video success]](https://blog.videoscribe.co/hubfs/How%20to%20create%20animation%20magic%20guide%20VideoScribe.png)
.jpg)

COMMENTS