
Popularity of animation in the classroom has grown significantly in the education sector. Firstly, because of the COVID-19 crisis which left many educators in a remote-first learning environment but secondly (and most importantly) because animation in the classroom is incredibly effective. As Ms Cole said in our recent case study blog post, “Animated videos are an effective teaching tool because they cater to different learning styles. They also allow students to work at their own pace as they can pause the videos at any time.”
Whether you’re teaching remotely or looking to introduce animated videos to your tool kit, you may be wondering ‘how can I create animated graphs within VideoScribe’? This is where we can help! In this blog, we’re going to show you how you can create a line graph, bar graph and pie chart directly in VideoScribe.
Want to see what we mean? Check out our video below:
Like what you see? You can create video content like and so much more in VideoScribe. Plus, you can do a free 7 day trial of VideoScribe with no payment details required!

Creating a line graph in VideoScribe
Let’s start with the line graph. We turn to line graphs to display changes over periods of time. Visually, you’re able to quickly see the range from minimum to maximum and where “changes” have taken place. In this example, we're working with a line graph that displays the temperatures in New York over a 6 day period:
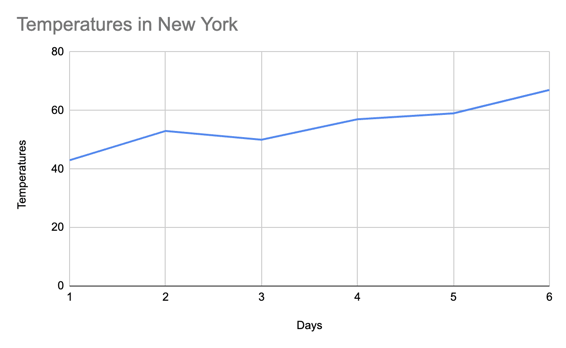
To recreate this line graph in VideoScribe, you need to have your dataset handy. The next step is to ‘Create a New Scribe’ and find the 'Add New Chart' button at the bottom right hand side of your working screen.
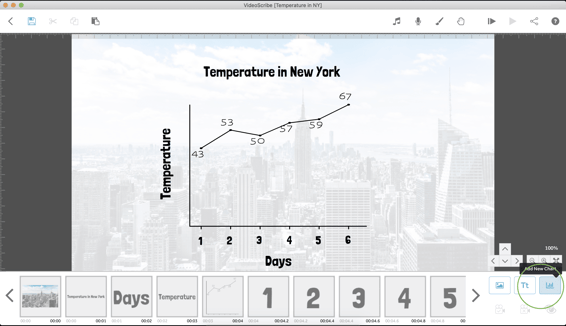
This will bring up the data input screen. In the example above, we've put the temperature figures in the Labels and Data Values section. We've changed the Chart Type to Line. That's it! You've got the choice to change up the styling by adjusting the fonts, border thickness and coloring. Here's our finished product!

Creating a bar graph in VideoScribe
Next up is a bar graph. Let's be real, the best thing about bar graphs is the comparison view. In this example, we have the survey results of everyone's favorite fruit in a boring, static bar graph 😴. 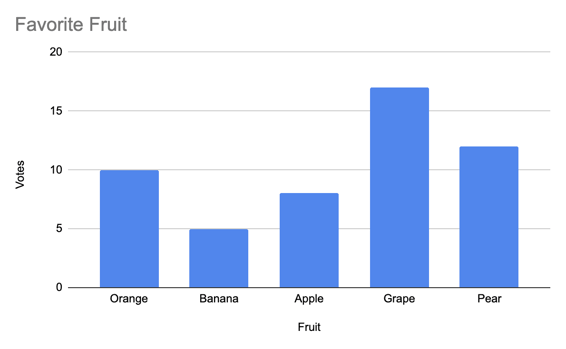 In VideoScribe, once again we click the 'Add New Chart' button and select Bar as the Chart Type. In this example, we have put the fruit name from the survey i.e. orange, banana, apple, grape and pear, as the Labels and the survey responses as the Data Values. We've also selected the Color option for a bit of fun and changed up the font. Here's our finished product!

Creating a pie chart in VideoScribe
A pie chart is a unique graphic that uses a circle to represent data. The circle graph is divided into slices to illustrate the statistical proportion. In this example, we're looking at pet ownership. Here's the static visual:
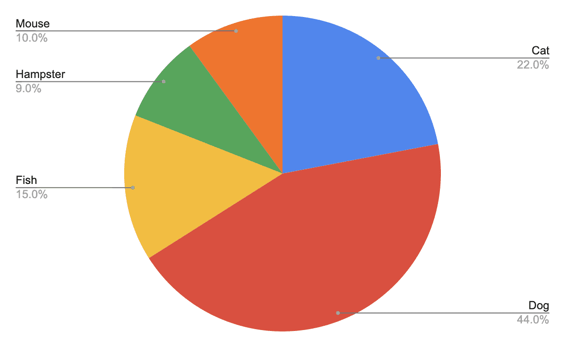
Once again, we click the 'Create New Chart' button on the right hand side of the screen. In the Labels section, we've put the types of pets i.e fish, dog, cat, hamster and mouse. In the Data Values section we input the percentage of ownership. Once again, we've ticked the Color option and placed it in our scene with more animated pets. Check out the finished product:

Creating animated graphs is a simple and effective way to illustrate your findings to your students. Plus, by including other animations from the VideoScribe library, you add a lot more visual excitement. It takes minutes and will have your students more engaged than just a static representation.
To get started with VideoScribe, start your free 7 day trial today! Looking to purchase multiple subscriptions for you and your team? Find out more here.
.png "VideoScribe")


![How to create animation magic [3-part guide to video success]](https://blog.videoscribe.co/hubfs/How%20to%20create%20animation%20magic%20guide%20VideoScribe.png)


.jpg)


COMMENTS